
As you know, we are a start-up serious about the environment. As there is an ongoing lockdown, we were curious to know the environmental changes during this course. I’m sure most of our readers will be as well.
We usually measure the changes in the environment by changes in Carbon footprint. In case you are unaware of the Carbon footprint, you can refer to our article here.
Before we jump into how India is doing, it would be nice if we could get a glance at where different countries are and where does India stand, isn’t it?
Before Covid19
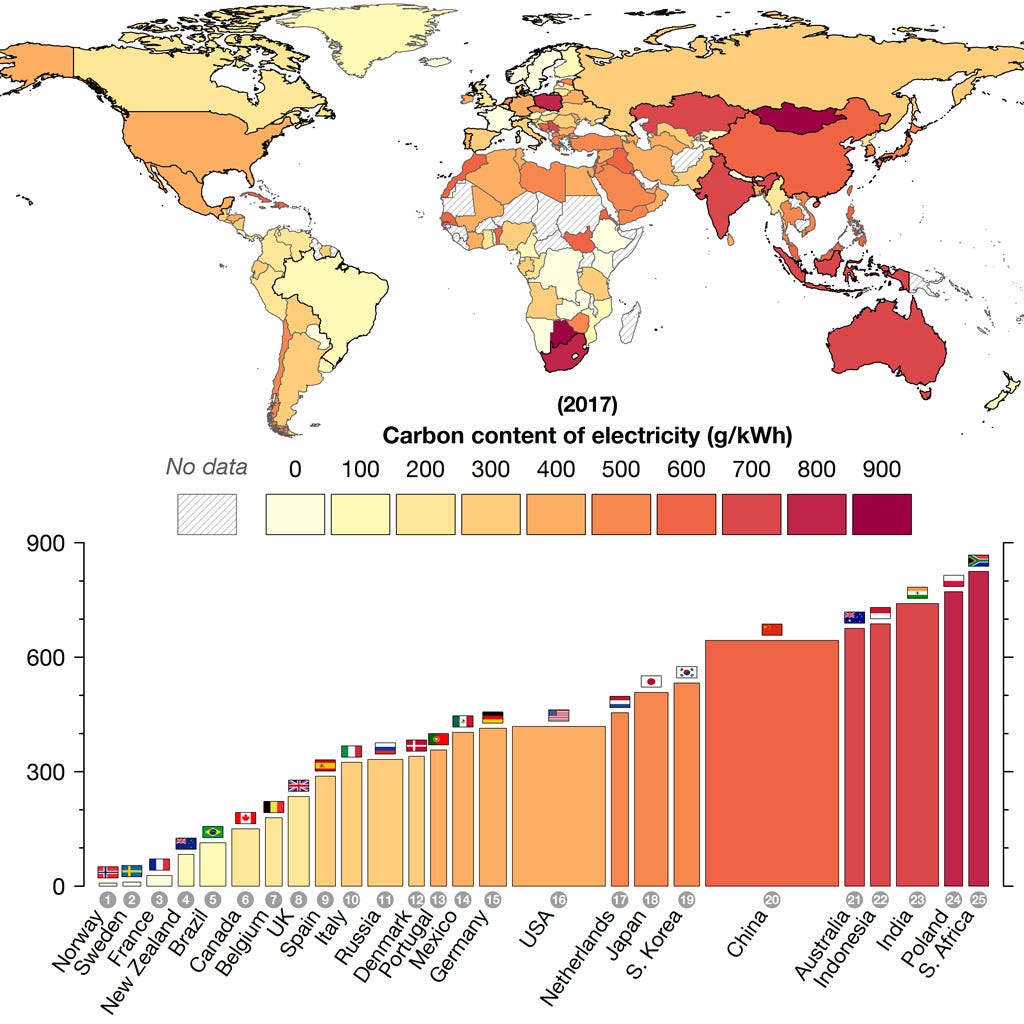
The above picture depicts how G25 countries stand against each other in Carbon emissions. Here, India falls in the range of 800g/kWh. It means we emit 800g of CO₂ per electrical unit consumed. Although there has been a push to use renewables, India’s emissions increased by 50g/kWh during 2008–2017.
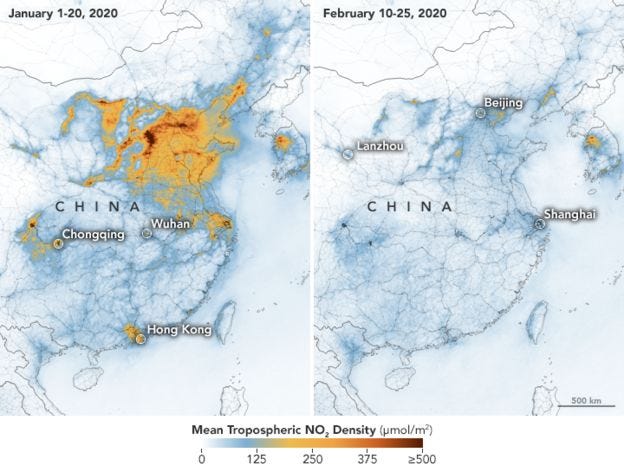
Change in emissions: China
China has been selected here owing to the reason that it is the 1st country where a lockdown was implemented on a full-scale, at the start of 2020. This will also allow us to see if we have actually reduced any relative emissions as such.
Emissions reduced by 25% at the start of 2020 in China owing to lockdown. Factories have been shut down and it is reported that coal use also fell by 40%.
However by the end of March, with covid19 cases dropping, air pollution levels and carbon emissions seemed to be on the rebound (according to CarbonBrief).
Emissions: Europe and the US
In Italy, where natural gas is used in the majority to generate electricity, demand was down by 27% in early March, as compared to last year. France (nuclear) and the UK (natural gas) have also followed the suit. According to Marcus Ferdinand (analyst at Independent Commodity Intelligence Services), EU power demands could fall by 6.2% by the end of 2020.
With the demand in electricity going down, along with air-traffic and industrial production, Ferdinand predicted that emissions could fall by 389 million metric tons of CO₂ (close to 9% of total EU emissions).
Although there isn’t a widespread lockdown announced, the effects of the virus are showing up. In New York, pollution levels are down by 50% because of the measures taken to control the spread of the virus. Transportation in the US is the largest contributor to the carbon emissions and passenger vehicles account to nearly 60% of it. According to Trevor Reed (INRIX), US passenger vehicle traffic was down by 38%.
US electricity demand is a complex trend to understand. According to Scotiabank, power demand collapsed in industry and commercial sectors. Currently, the residential sector is mitigating it, owing to the increased use in lights, TVs and interestingly, gaming consoles.
How about India?
Nationwide electricity demand fell to 2.78 billion units on March 25, the 1st day of the 3-week lockdown. That was a nearly 20% drop when compared to the national average of 3.45 billion units (Source: The Hindu).
Although there is a drop in overall demand, some states have reported a spike in usage. India’s most populous state, UP, reported an increase of 3.4% on March 25 whereas its surrounding states Uttarakhand and Himachal Pradesh recorded a decrease of 40%.
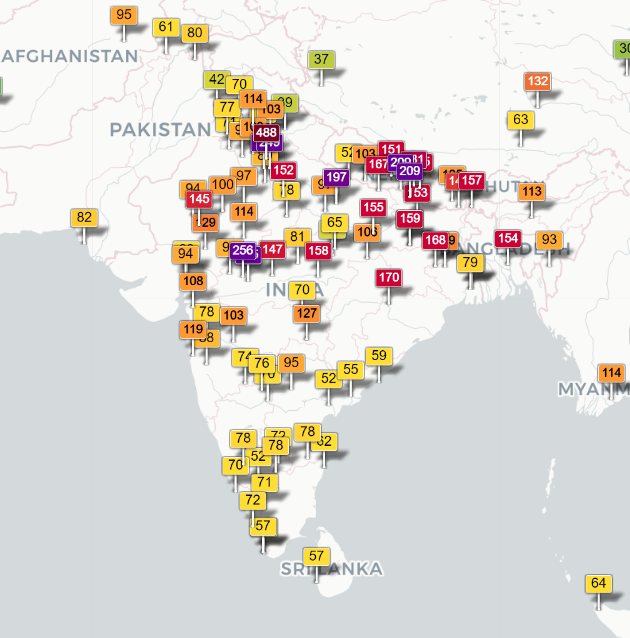
In pollution levels, New Delhi has been taken as a reference owing to its record pollution levels in Nov 2019. As of March 20, the AQI (Air Quality Index) stood at a median of 160 as compared to 97 on 10th April 2020, showing a decrease of nearly 40%.
Though there is a huge reduction in emissions due to COVID-19, the exact number cannot be concluded due to the unknown economy effects COVID-19 might lead to.
If you are wondering how Covid19 fares when compared to the recession in 2008–09 in terms of emissions, 2020 might see a fall in global emission of 0.3% as compared to 1.3% in 2008–09 (BBC).