In our previous blog, we covered the reasons behind the high energy bills we have incurred in the recent past.
In this blog, let us look at the patterns of our energy consumption at home. What are the things that are leading to high energy bills and by how much?
Before we straight away go into the numbers, let’s see how our habits changed in regards to energy consumption.
Per household energy consumption
What has been the per household usage trend? Is it increasing or decreasing? And by how much? This calculation below should give us some idea.
The Total Electricity generated in FY2019 = 1389 TWh (Source: Ministry of Power)
Share of Residential Consumption (1)= 347.25 TWh(~25%) or 347.25 billion units
Total Population of India = 1.38 Billion
Total Electrified Population (2)= 1.31 Billion (~95%)
Avg Household Electricity Consumption per person = (1)/(2) = 265.08 Units
Average Family Size (D)= 4
Average Household Electricity Consumption (per yr) = 1060 Units
A similar calculation for FY2015 showed an avg. household consumption of 885 units.
There has been an increase of 20% in overall usage over the past 4 years.
End-use energy consumption share
Having known that our energy consumption is on an exponential increase, let us see what lead to this exponential rise and the things on which we consume most.
In the 1990s, cooking and water heating accounted for about 90 per cent of household energy use. Space heating is never a large component due to India’s subtropical and tropical climate, whereas air conditioning was a luxury confined to a small percentage of households. Biomass dominated cooking fuel (over 90 per cent in the early 1990s). Kerosene was the major fuel for lighting, with about 60 per cent of households using kerosene lamps. Kerosene was also used widely in cooking (about 50 per cent of the commercial cooking fuel supply). In the early 1990s, only about 40 per cent of all households had access to electricity (Source: UN)
With rising incomes, a growing share of household energy is being used for electric appliances and a decreasing share for cooking. As of today, 95%+ households have access to electricity.
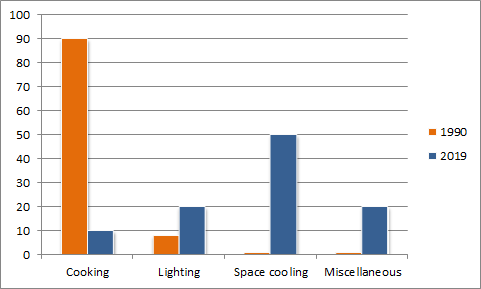
In 2019, space cooling in the form of ACs & fans contributed to 50% of the energy bill in an average household. Cooking has taken the back seat with 10% usage. Miscellaneous loads like geysers, motors, inverters and washing machines have been seen with an increasing trend. And the consumption share of lighting and TVs is on a decreasing trend, around 20%.